Prometheus Remote Write Exporter
September 05, 2020
About the project
During my remote 12 week internship at AWS, I had the privilege of working alongside 10 interns with a principal engineer as our manager. We worked on open source projects to support two new AWS services which have since launched - Managed Prometheus and Managed Grafana.
OpenTelemetry
We primarily worked on OpenTelemtry, a CloudNative Computing Foundation (CNCF) open source project aiming to "make robust, portable telemetry a built-in feature of cloud-native software". OpenTelemetry is a set of APIs, SDKs, libraries, and agents to collect distributed traces and metrics from applications. Collected data can be analyzed in observability tools like Prometheus (metrics) and Jaeger (traces). As an engineer, understanding the health and performance of your applications is crucial. OpenTelemetry makes it easy to monitor across languages, infrastructures, and services.
We studied the OpenTelemetry specification and the language-specific implementations to identify potential projects. Each language must implement the API and SDK specification and provide other components like instrumentation libraries and exporters. Some language implementations (i.e. Java, Python, and Go) are very mature. Others (i.e. Rust, Swift, and C++) are in the early stages of development.
My teammate, Eric, and I chose to build a Prometheus Remote Write API Exporter for the Go SDK. The exporter can be used in Go applications collecting metrics data (server latency, HTTP status codes, etc.) with OpenTelemetry. The exporter will send collected metrics to backends using the Prometheus Remote Write API specification. One example use case would be sending metrics to Cortex, a highly scalable, multi-tenant Prometheus. The exporter is ideal for large, often microservice-based, applications collecting large amounts of data.
The 'Technical Details' section at the end of this page explain more of how the exporter works
Project Objectives
- Build a secure, scalable, and reliable exporter
- Follow Go, AWS, and OpenTelemetry best practices including Test Driven Development (TDD)
- Learn relevant new technology (Go, Docker, Cortex, etc.)
Process
The project began with a thorough design process. We wrote nearly 50 pages of documentation including:
- Requirements analysis
- Design document
- Testing strategy
- Implementation details
- Documentation for the end user
We had weekly intern team reviews, internal AWS reviews, and external reviews with OpenTelemetry maintainers for each document and PR. It was slow but did improve the design.
After the documentation was approved, we began coding. With just 3 weeks to code, we had to work quickly and ensure PRs were approved fast. The thorough design process definitely made coding faster, but I think we could have finished the project faster overall by spending a little less time on the design.
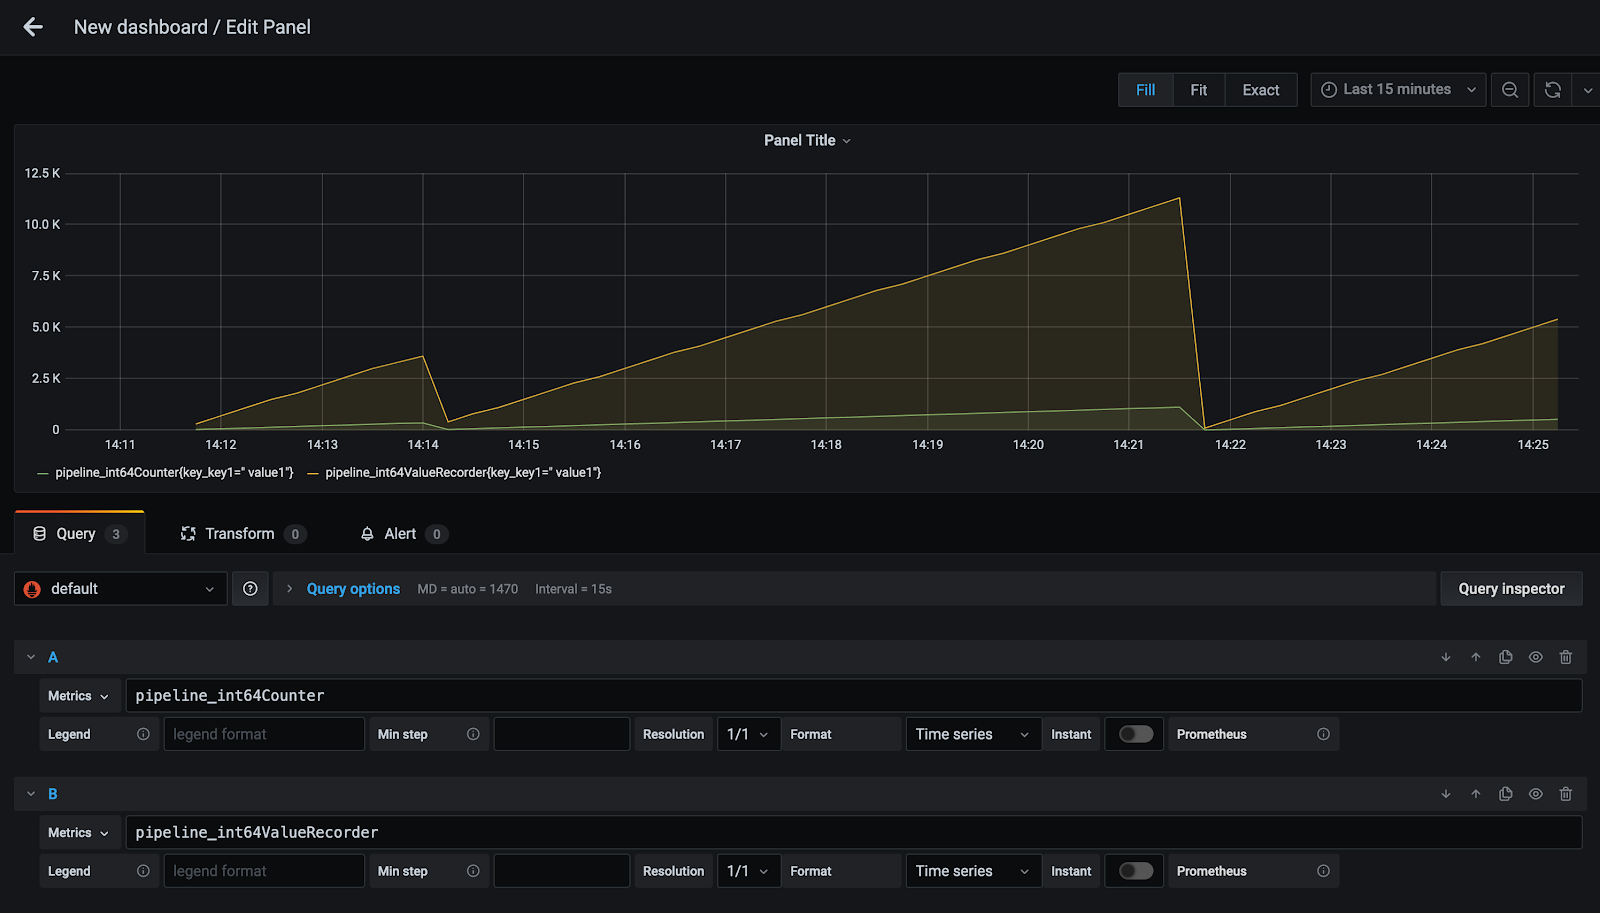
I focused on implementing the exporter interface from the OpenTelemetry specification, converting metrics data to the Prometheus Remote Write API format, creating a Docker setup for the example project, and unit and integration testing. The Docker setup used Docker compose to run a Go application collecting metrics, Cortex to ingest metrics, and Grafana to visualize metrics.
Outcomes
We successfully built and contributed upstream a working version of the exporter with tests, an example setup, and documentation. The design and code can be used as prior art to implement the exporter in other language SDKs like JavaScript or Python. Although it's not the most glamorous piece of code, it's seeing some love at AWS and other observability companies and may soon be helping ensure important applications are healthy and performant.
Learnings
Building this project pushed me in many ways to be a better engineer and communicator.
Technical Skills
I had to quickly get up to speed with, or get better at, a ton of new technology including:
- Go
- OpenTelemetry, Grafana, Prometheus, and Cortex
- Docker
- Test Driven Development
- Git, GitHub
Lessons Learned
One key experience helped me learn about attention to detail. The exporter has to send metrics with a timestamp. The data received by the exporter has a timestamp (time.Time from Go). The Prometheus Remote Write API sends data with a timestamp in milliseconds. I made the assumption that the time.Unix() method would return the time in milliseconds (because Javascript). Somehow, that assumption slipped through the design and code review process despite it being very wrong.
We finished our code, all our tests were passing, and we hooked everything up to test our demo. Everything seemed to be working fine. The Go app was collecting metrics, Cortex was running, Grafana was connected, but no data was being displayed. After a few hours of testing, we eventually noticed the problem. We were sending the timestamp with a the wrong number of digits (seconds vs. milliseconds).
Aghh, I couldn't believe it. How did we miss something like that? Eventhough we had such thorough reviews and tons of passing tests, our exporter wasn't working.
Luckily, we caught the mistake. We figured out the conversion, made the fix, and everything worked great. It was a small error that ultimately had little impact (just some lost time and a bit of extra stress), but it could have been catastrophic in another system.
I'll definitely be much more thorough in the future.
Project Links
Technical Details
Thanks for reading this far. If you're interested, keep reading for more info on how the exporter actually works.
Written in Go, the exporter receives metrics from Go applications instrumented with OpenTelemetry and sends them via HTTP to any metrics backend that follows the Prometheus Remote Write API (PRWA) specification, the most popular being Cortex. To accomplish this, the exporter has to do the following:
- Interface with the OpenTelemetry Go SDK
- Convert metrics to the TimeSeries format defined by the PRWA.
- Send TimeSeries via HTTP
The diagram belows shows the methods defined by the exporter. In the next section, I'll walk through the data path and explain what methods are doing what.

Note: Entities with an asterisk (*) are not actual classes, but are logical groupings of methods defined in the Cortex package.
Data Path
OpenTelemetry provides instruments which are used to collect metrics data. For example, a counter will record monotonically increasing values. Each instrument maps to a default aggregation. Each aggregation stores metrics data in some useful format. For example, a sum aggregation records the sum of all values collected by an instrument.
The process of collecting, aggregating, and exporting metrics is handled as shown in the following diagram. SDK components are in Grey.
OpenTelemetry SDK

- Controller - Starts the metrics collection process. There are push and pull controllers. This
exporter uses a push controller.
- Push: Collects and exports metrics on a set timeout (Defaults to 10s)
- Pull: Collects and exports metrics when called via HTTP by an external service
- Processor - Tracks the collection process and holds the aggregated metrics in a CheckpointSet
- Accumulator - Collects metrics from each Aggregator
- Aggregator(s) - Collects metrics from a specific instrument based on an aggregation type
- Exporter - Sends metrics to a specific backend
In the case of our exporter, the controller will call Collect() on the Accumulator which stores a CheckpointSet in the Processor. The Controller then sends the CheckpointSet to the Exporter. The CheckpointSet is a batch of collected metrics Records. Each Record contains a start and end timestamp pertaining to its collection period, metadata like labels, and an aggregation.
Exporter

The Exporter must do the following:
- Convert the CheckpointSet to an array of TimeSeries.
- Build and send an HTTP request to the backend of choice (Like Cortex)
Conversion
The PRWA defines a TimeSeries format.
type TimeSeries struct {
  Labels  []Label
  Samples []Sample
}

type Label struct {
  Name   string
  Value  string
}

type Sample struct {
  Value     float64
  Timestamp int64
}
Each Record in the CheckpointSet must be converted to one or more TimeSeries based on its aggregation type. The aggregations are conversions are shown below.
- Sum aggregation - Create one TimeSeries containing a single sample with the sum value
- LastValue aggregation - Create one TimeSeries containing a single sample with the last value
- MinMaxSumCount aggregation - Create four TimeSeries, one each for the min, max, sum, and count values
- Histogram aggregation - Create 3 + n TimeSeries, one for each histogram bucket and the count, sum, and bucket with infinity as the upperbound
- Distribution aggregation - 4 + n TimeSeries, one for each quantile and 4 for the MinMaxSumCount values
Sending
After converting the CheckpointSet to TimeSeries, it is wrapped in a WriteRequest, compressed using Snappy, and sent via HTTP. This process can be configured by the user, including adding authentication to the request or even including a custom HTTP Client.
Usage
- Install the exporter and provide configuration
// Create a new Config
config, err := utils.NewConfig("config.yml")
if err != nil {
  fmt.Printf("Error: %v", err)
}
fmt.Println("Success: Created Config struct")

// Create and install the exporter
pusher, err := cortex.InstallNewPipeline(*config)
if err != nil {
  fmt.Printf("Error: %v", err)
}
defer pusher.Stop()
- Create instruments and collect metrics
// Create meter and instruments
meter := pusher.Provider().Meter("example")
ctx := context.Background()

// Create a counter instrument
counter := meter.Must(meter).NewInt64Counter("counter_name")

// Collect metrics
counter.Add(ctx, 100, label.String("key", "value"))
Metrics will then be sent to the endpoint provided in the configuration. For our testing, we sent metrics to Cortex and visualized them in Grafana using Cortex as a data source.
There's still a lot more detail to provide, but I hope you liked the post. If you have any questions, feel free to reach out.